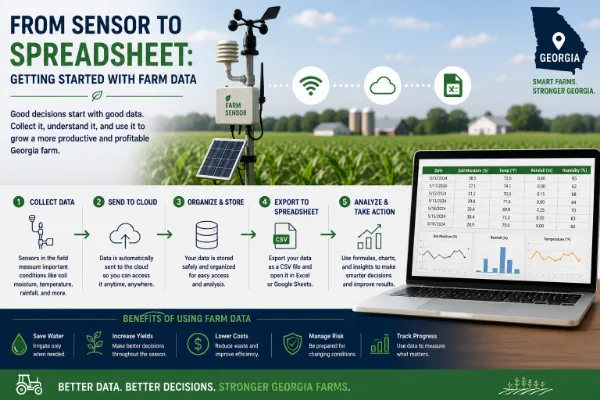
On June 1, 1991, a single agricultural weather station began transmitting data from Griffin, Georgia. That station was the start of what's now called the UGA Weather Network originally the Georgia Automated Environmental Monitoring Network which has grown to 87 stations spread across the state and is one of the oldest continuously operating state weather networks in the country. Most discussions of "smart farming weather stations" treat the technology as a recent IoT innovation. In Georgia, the underlying infrastructure predates the term "IoT" by roughly two decades, and it's still one of the most consequential pieces of agricultural technology in the state.
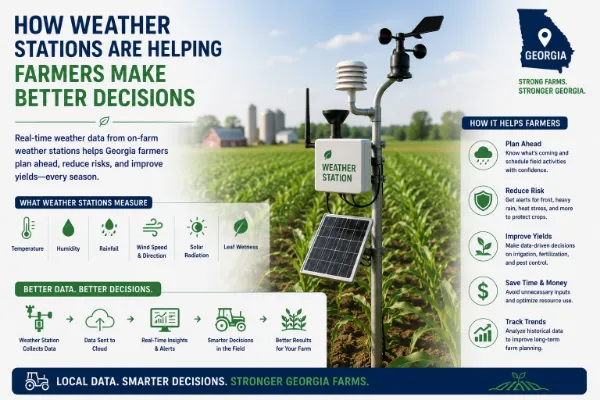
A UGA Weather Network station collects considerably more than a basic weather forecast requires. Each station records air temperature, relative humidity, rainfall, solar radiation, wind speed and direction, barometric pressure, and soil temperature at multiple depths (commonly 2, 4, and 8 inches), with data collected roughly every 15 minutes and made available through the network's public website. This depth of measurement particularly solar radiation and multi-depth soil temperature, which most general-purpose weather services don't track at all is what separates an agricultural weather station from a standard forecast, and it's precisely the data that farm decision-making actually depends on.
Combined with soil moisture sensor data, weather station readings on rainfall, temperature, and solar radiation feed evapotranspiration calculations an estimate of how much water a crop is actually losing and needs to replace giving a far more precise basis for irrigation timing than a fixed calendar schedule. The UGA Weather Network's website includes built-in evapotranspiration calculation tools specifically for this purpose, directly supporting the same precision irrigation programs run through the Flint River Soil and Water Conservation District and UGA's Stripling Irrigation Research Park.
For Georgia's fruit, vegetable, and nursery growers, a frost event at the wrong point in a crop's development can wipe out a season's yield. Localized, real-time temperature data rather than a regional forecast that may not reflect a specific field's microclimate gives growers a more precise window for deploying frost protection measures like irrigation-based freeze protection or wind machines.
Crop development and pest emergence are both driven more by accumulated heat over time than by calendar dates. Growing degree day calculations, built from continuous temperature data, help predict when a crop will reach a specific growth stage or when a pest population is likely to emerge, supporting more precisely timed planting, spraying, and harvest decisions. Chill hour accumulation tracking the cumulative cold exposure fruit and nut trees need to break dormancy properly is particularly critical for Georgia's peach and pecan industries, where insufficient chill hours in a warm winter can directly reduce yield the following season.
Wind speed and direction data help growers time pesticide and herbicide applications to minimize drift risk, avoiding both wasted product and the compliance and liability issues that come with an application drifting onto a neighboring property or sensitive area.
A newly installed private weather station on a single farm gives a grower real-time conditions, which is valuable. What it can't provide is historical context how this year's rainfall or temperature pattern compares to the past three decades for that specific region. The UGA Weather Network's continuous record, dating back to 1991, allows researchers, extension agents, and growers to compare current conditions against long-term regional patterns, supporting decisions that depend on historical trend data, not just today's forecast. This is also why the network has become valuable well beyond agriculture: the Georgia Forestry Commission uses it to support wildfire monitoring, and both conventional and solar utilities use the data for load forecasting and equipment placement decisions.
During Hurricane Michael in 2018, a UGA Weather Network station in Donalsonville, in Seminole County, recorded a 115 mph wind gust the strongest gust measured in Georgia during the storm. Because commercial weather infrastructure in that part of the state went down during the storm, the UGA station's reading became part of the official record included in the National Hurricane Center's final storm report. The National Weather Service, which is now the largest single purchaser of UGA Weather Network data, has specifically credited the network with providing storm monitoring coverage in areas where their own stations failed. This is a useful illustration of the broader point: a well-maintained agricultural weather network doesn't just serve farm decisions on a good-weather day it becomes critical infrastructure during exactly the kind of severe weather event when reliable data matters most.
A separate economic analysis focused on just one station in Camilla, in the heart of the Lower Flint River Basin's irrigated farmland estimated its annual value to producers at nearly $850,000 a year, through the combination of irrigation scheduling support, frost monitoring, and degree-day tracking it enables for the surrounding agricultural region.
Georgia growers generally have two options, and they're complementary rather than competing:
- UGA Weather Network (georgiaweather.net) free, publicly available data from 87 stations statewide, backed by more than three decades of continuous historical record, ideal for regional decision-making and comparing current conditions to long-term patterns.
- On-farm private weather stations installed directly on an individual farm, capturing hyperlocal conditions that can differ meaningfully from the nearest public station, particularly for microclimate-sensitive decisions like frost timing in a specific low-lying field.
Many Georgia growers use both: the public network for broader regional context and historical comparison, and a private, farm-specific station where field-level precision genuinely changes a decision frost protection timing being the clearest example, since a difference of even a degree or two between a public station several miles away and conditions in a specific low-lying field can determine whether frost protection measures are needed.
- Start with the free UGA Weather Network data at georgiaweather.net before investing in a private station, since the nearest public station may already provide sufficient precision for many decisions, particularly for larger, more uniform fields.
- Use the network's built-in calculation tools evapotranspiration, degree days, and chill hour tools are already available on the site rather than requiring a grower to calculate them manually from raw data.
- Invest in a private, on-farm station where microclimate precision genuinely matters frost-prone low areas, high-value perennial crops like peaches or pecans, or operations spread across multiple distinct microclimates.
- Combine weather data with soil moisture sensors for irrigation scheduling specifically, since weather data alone (evapotranspiration estimates) and direct soil moisture measurement each capture different parts of the water availability picture, and the combination is more reliable than either alone.
Weather station data has been supporting Georgia farm decisions for more than three decades through one of the oldest agricultural weather networks in the country, and the case for using it has only gotten stronger as connected soil moisture sensors, degree-day calculators, and irrigation scheduling tools have been built directly on top of that same data. Whether a grower is timing a frost protection response, scheduling irrigation, or tracking chill hour accumulation for a pecan orchard, the starting point isn't new technology it's data infrastructure Georgia has already had in place since 1991, increasingly connected to the newer sensor and analytics tools built around it.
Frequently asked questions
Virtual fencing uses a GPS-enabled collar to create a software-defined grazing boundary instead of a physical fence. As an animal approaches the boundary, the collar emits an audio cue, followed by a mild electrical stimulus if the animal continues forward, teaching the animal to stay within the defined area.
Published research generally shows cattle learn to respond to a virtual boundary within one to two days, after which containment rates above 95 percent are commonly reported in controlled studies.
Common applications include detecting reduced rumination or activity as early signs of illness, identifying estrus through activity pattern changes for breeding timing, detecting the onset of calving, and monitoring body temperature for signs of infection.
Yes, though it looks very different from cattle monitoring. Poultry operations use house-level environmental sensors tracking temperature, humidity, ammonia, and ventilation performance, since broiler chickens are raised in enclosed, climate-controlled houses rather than open pasture.
There's no fixed threshold, but the labor-saving economics generally improve as herd size grows, since the fixed cost of a base station or monitoring system is spread across more animals. Smaller operations should weigh per-head technology cost against the specific labor savings for their situation.
Published research comparing virtual fencing to traditional electric fencing has generally found comparable welfare outcomes, though some studies note individual variation in how animals respond, with certain individuals receiving more stimuli than others during the learning period. This is an active area of ongoing research.
Originally called the Georgia Automated Environmental Monitoring Network, it's a statewide network of 87 agricultural weather stations operated by the University of Georgia since 1991, making it one of the oldest continuously operating state weather networks in the country.
Yes, the network's data is publicly available through its website, georgiaweather.net, including built-in tools for calculating evapotranspiration, growing degree days, and chill hours.
Weather data feeds evapotranspiration calculations estimating how much water a crop is losing and needs to replace, which, combined with soil moisture sensor readings, gives a more precise basis for irrigation timing than a fixed calendar schedule.
Chill hours measure the cumulative cold exposure fruit and nut trees need to properly break dormancy. This is particularly important for Georgia's peach and pecan industries, since insufficient chill hours during a warm winter can directly reduce the following season's yield.
Many growers use both. Public network data works well for regional decision-making and historical comparison, while a private, farm-specific station adds value where hyperlocal microclimate precision matters, such as frost protection timing in a specific low-lying field.
Yes. The UGA Weather Network's data is also used by the Georgia Forestry Commission for wildfire monitoring, by utilities for load forecasting and equipment placement, and by the National Weather Service, which has relied on the network's data during severe storms when some of its own stations went offline.
Related articles

 Agriculture IoT