 Manufacturing IoT

Machine Monitoring in Georgia Factories: How to Read the Signals Behind Downtime, Micro-Stops and Hidden Capacity
Manufacturing IoT
Published by IOT Georgia Research & Editorial Team
- What Machine Monitoring Actually Captures
- The Losses Monitoring Makes Visible
- Reading the Signals on Georgia's Most Common Equipment
- CNC machining centers
- Injection molding
- Packaging and food lines
- Press and stamping lines
- Extrusion and continuous processes
- Patterns That Tell a Story
- Getting Useful Reason Codes From Operators
- Turning Data Into a Daily Routine
- Common Mistakes
- An Illustrative Example
- Where Machine Monitoring Is Heading
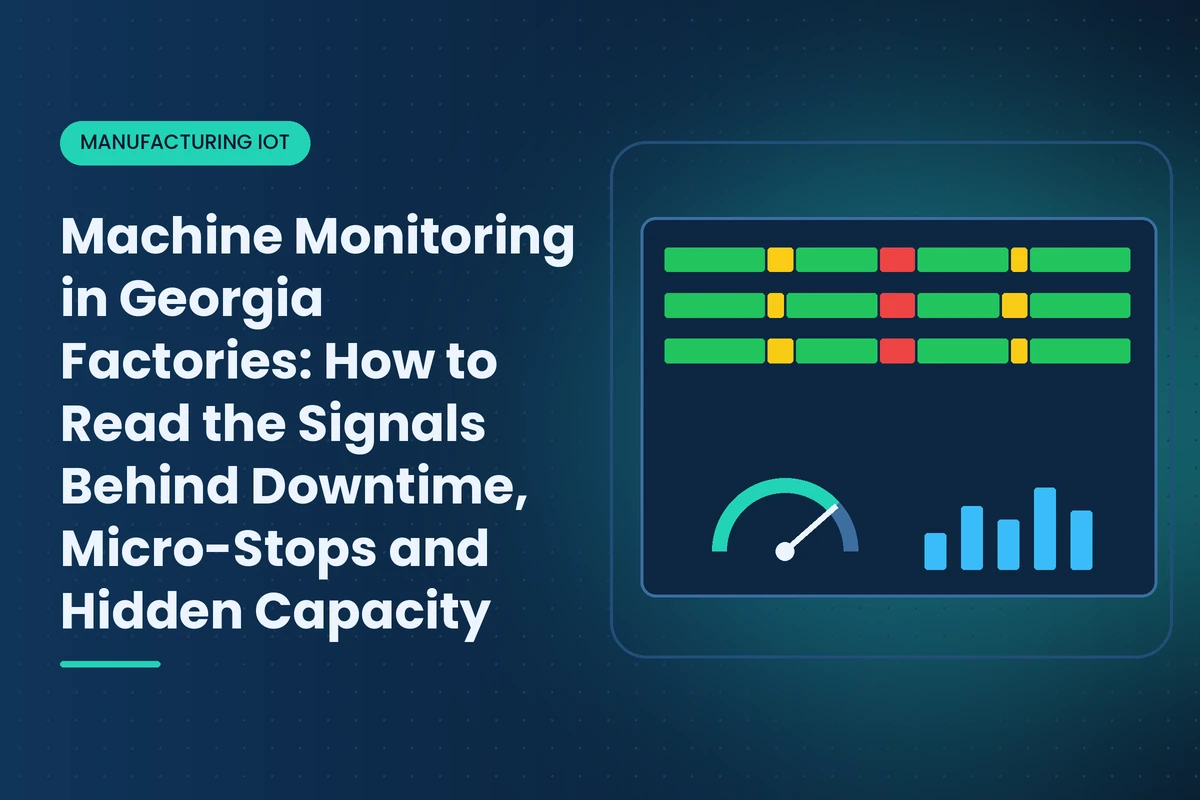
Installing machine monitoring has become the easy part. Clamp-on current sensors, stack light taps and gateways that read controller data can connect most of a Georgia plant in weeks. The harder part comes next, when a supervisor opens the dashboard and sees a wall of green, yellow and red bars. What do the patterns mean? Which ones deserve attention? Why does the data disagree with what everyone believed about the line?
This guide focuses on that second step: reading the signals. It explains what machine monitoring captures, which losses it exposes, how to interpret the patterns that show up on the equipment most common in Georgia factories, and how to turn the data into daily decisions. If you are still deciding whether to start, our 90-day IoT plan for Georgia manufacturers covers the setup side.
What Machine Monitoring Actually Captures
| Signal | Typical Source | What It Reveals |
|---|---|---|
| Machine state (running, idle, stopped, faulted) | Current sensor, stack light, controller | Utilization, downtime duration and frequency |
| Part or cycle count | Controller counter, proximity sensor | Output rate, performance against standard |
| Cycle time | Controller timestamps or count intervals | Slow cycles, drift, operator or material variation |
| Fault and alarm codes | Controller | Recurring technical causes of stops |
| Load, spindle power or motor current | Drive, controller, power meter | Tool wear, jams, abnormal operation |
| Energy use | Power meter | Idle waste, demand peaks, efficiency by asset |
| Reason codes | Operator tablet or terminal | The human context behind each stop |
No single signal tells the full story. Machine state tells you that a press stopped. The reason code tells you it was waiting on coil. The cycle time trend tells you it was already running slow for an hour before that. The value comes from combining them.
The Losses Monitoring Makes Visible
Most plants discover that their biggest losses are not the dramatic breakdowns everyone remembers. They are smaller, more frequent and easier to fix. Machine monitoring typically exposes six categories:
- Breakdowns. Long, unplanned stops with a technical cause. Usually well known already.
- Setup and changeover. Time between the last good part of one job and the first good part of the next. Often underestimated by half.
- Micro-stops. Stops of a few seconds to a few minutes, such as jams, sensor trips and small adjustments. Individually trivial, collectively huge.
- Slow cycles. The machine runs, but slower than its standard. Invisible without cycle time data.
- Startup losses. Scrap and slow running while a process warms up or stabilizes.
- Quality losses. Parts made that later fail inspection.
Plants that measure only breakdowns usually believe their equipment is available 90 percent of the time or more. Once micro-stops and slow cycles are counted, the real figure is often far lower. That gap is hidden capacity, and it is usually cheaper to recover than buying another machine.
Reading the Signals on Georgia's Most Common Equipment
CNC machining centers
Machine shops supplying aerospace work around Marietta, Savannah and Columbus, and auto suppliers across the state, run large fleets of CNC equipment. Watch spindle run time rather than just power-on time, because a machine can be on and loaded but not cutting. Rising spindle load across a batch points to tool wear. Frequent short stops during a job often mean chip management problems or operators measuring parts at the machine. A long gap after each job ends usually reflects waiting for the next program, tooling or material, which is a planning issue, not a machine issue.
Injection molding
Plastics plants live on cycle time. A few tenths of a second added to each cycle can erase margin on high-volume parts. Monitor actual cycle against the standard, count short shots or rejected cycles if the press reports them, and watch for drift after startup or after material changes. Presses that frequently alternate between running and idle may have part removal or conveyor problems downstream.
Packaging and food lines
Food and poultry plants across Georgia run long, linked lines where one slow machine starves or blocks the others. Monitor every major station, not just the filler or wrapper, and look for starved and blocked states. A case packer that stops often because it is starved is not the problem; the machine feeding it is. Sanitation windows should be logged as planned stops so they do not distort availability.
Press and stamping lines
Auto suppliers serving Kia in West Point and the Hyundai Metaplant in Ellabell rely on stamping. Strokes per minute, die change duration and coil change time are the key metrics. Monitoring often reveals that die changes vary widely between crews, which makes standard work and pre-staging the first improvement.
Extrusion and continuous processes
In the Dalton area and in plastics and film plants, extruders run continuously, so the question is less about stops and more about rate and stability. Track throughput, melt temperature and motor load together. Rate reductions made to keep quality in range are a hidden loss worth measuring.
Patterns That Tell a Story
| Pattern in the Data | Likely Cause | First Thing to Check |
|---|---|---|
| Machines start 20 to 40 minutes after shift start | Meetings, warmup, missing materials or tools | Shift startup routine and material staging |
| Output drops during breaks and lunch | No relief coverage | Staggered breaks or relief operators on constraint machines |
| Second or third shift trails first shift | Less support staff, fewer maintenance techs | Response time to stops by shift |
| Cycle time creeps up through a run | Tool wear, heat, material variation | Tool change intervals and process settings |
| Hundreds of stops under two minutes | Jams, sensors, minor adjustments | Top micro-stop locations and fault codes |
| Monday mornings consistently worse | Startup problems after weekend shutdown | Warmup procedures, humidity effects on idle equipment |
That last pattern has a Georgia twist. Humid summer weekends can leave moisture in idle motors, panels and pneumatic lines, which shows up as Monday start-up faults. Our guide to predictive maintenance in Georgia's climate explains how to address it.
Getting Useful Reason Codes From Operators
Automatic signals show when and how long a machine stopped. Only people can reliably say why. Good reason code design makes or breaks a monitoring program:
- Keep the list short. Eight to twelve top-level reasons per machine type. Long lists get ignored or everything becomes "other."
- Use the language of the floor. "Waiting on forklift" beats "material handling delay."
- Support every language on your crew. Many Georgia plants run multilingual teams, so offer reason codes and screens in the languages operators actually use.
- Ask only for meaningful stops. Prompting for every ten-second pause creates fatigue. Set a threshold, often two to five minutes.
- Show operators the results. When people see their inputs lead to fixes, data quality improves.
Turning Data Into a Daily Routine
Monitoring changes results only when it changes conversations. A simple structure works in most plants:
- Start of shift: Supervisors review the previous shift's top three losses on the constraint machines.
- Daily production meeting: Maintenance, production and planning agree on one or two actions from the data.
- Weekly review: Leaders look at trends in OEE, micro-stops and changeover time, and check whether last week's actions worked.
- Monthly: Decide whether to expand monitoring, add signals or tackle a new loss category.
Keep screens on the floor simple. A large display showing current state, output versus target and the top stop reason for the shift is more useful to operators than detailed analytics.
Common Mistakes
- Chasing OEE as a single number. OEE is a summary. The action lives in the underlying losses.
- Comparing different machines on the same target. A 1990s press and a new servo press should not share a standard.
- Using data to blame people. Once operators feel watched rather than supported, reason codes stop being honest.
- Ignoring planned stops. If sanitation, maintenance and meetings are not coded, availability numbers become meaningless.
- Stopping at visibility. Dashboards do not improve anything unless someone owns the actions.
An Illustrative Example
Imagine a plastics plant near Columbus running 14 injection presses for appliance and automotive customers. Leadership believed the plant was capacity constrained and was pricing two new presses. After six weeks of monitoring, the data showed that presses ran well during the day but lost significant time on night shift waiting for mold changes, because only one mold setter worked nights. Cycle times on three presses had also crept above standard after a resin change nobody had revalidated. Adding a second night mold setter and resetting the process on those presses recovered enough capacity to delay the equipment purchase by more than a year. The insight did not come from advanced analytics. It came from reading basic signals by shift and by press.
Where Machine Monitoring Is Heading
Monitoring platforms are moving from showing what happened to suggesting what to do. AI tools can now group stop events, spot unusual cycle patterns and draft shift summaries automatically. Integration with scheduling and maintenance systems means a monitored stop can trigger a work order or a schedule change without manual steps. Georgia manufacturers exploring these tools can find support through Georgia AIM at Georgia Tech and the Georgia Manufacturing Extension Partnership. The foundation stays the same, though: accurate states, honest reason codes and a team that reviews the data every day.
For related reading, see our guide to sensors that reduce downtime on Georgia factory floors, our comparison of wired and wireless factory connectivity and our overview of quality control sensors. To find monitoring vendors and integrators, browse the IoT Georgia company directory or explore manufacturing IoT providers in Columbus and Marietta. Browse more of our Manufacturing IoT coverage.
Related articles
Manufacturing IoT
 Manufacturing IoT
Robotics and IoT Are Changing Automotive Manufacturing in Georgia: What the Robot Fleet Needs to Run Well
 Manufacturing IoT
Hyundai's Georgia Metaplant: Inside the State's New Smart-Manufacturing Model
 Manufacturing IoT